Work Zone Data
Work Zone Data
At a Glance
Note:
The National Work Zone Safety Information Clearinghouse is working to update the information on this page to include 2022 NHTSA FARS data. We anticipate the updates will be available in May 2024. In the meantime, please visit the FHWA Work Zone Facts & Statistics website.

Fatal Crashes
, National Highway Traffic Safety Administration, U.S. Department of Transportation.")
, National Highway Traffic Safety Administration, U.S. Department of Transportation.")
, National Highway Traffic Safety Administration, U.S. Department of Transportation.")
Source: Fatality Analysis Reporting System (FARS), National Highway Traffic Safety Administration, U.S. Department of Transportation
*Commercial motor vehicles consist of large trucks with gross vehicle weight ratings of more than 10,000 pounds and buses.
** Pedestrians identified in FARS as being at work or a construction/maintenance/ utility worker or a transportation worker (e.g., maintenance workers, safety service patrol operators). Other analyses indicate up to 38 percent of pedestrian fatalities in work zones are highway workers.
Estimates of Injury and Total Crashes


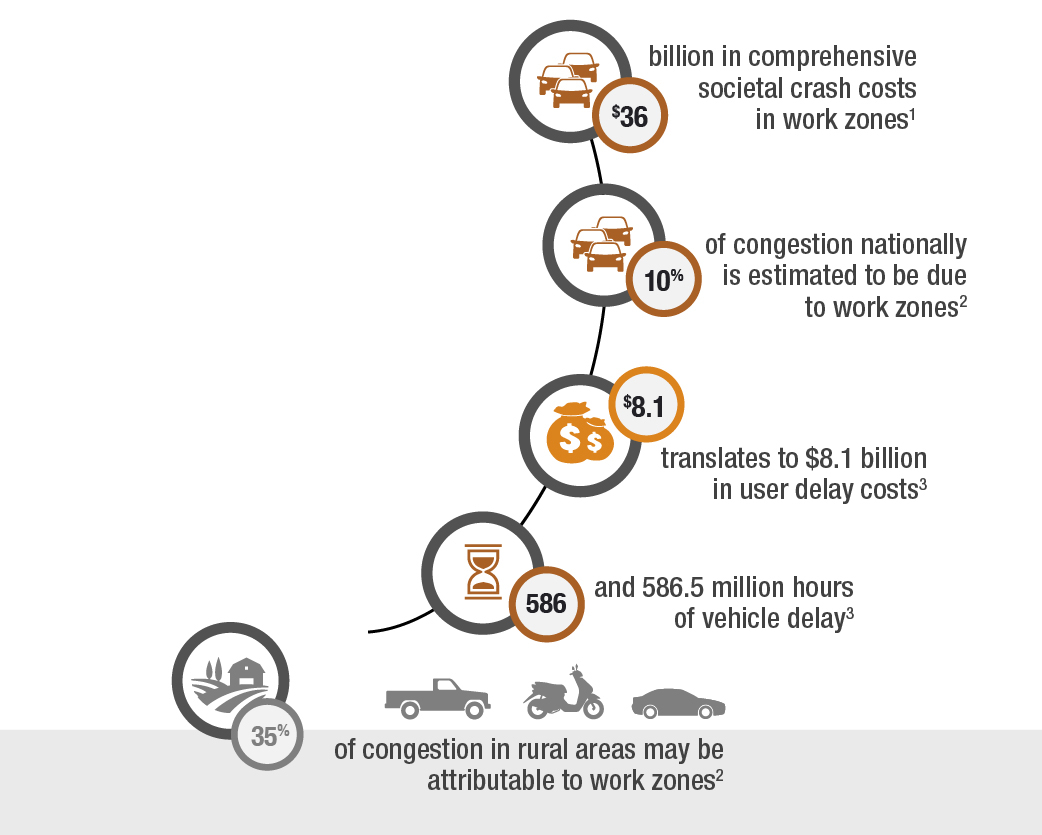
Economic Impacts
Source: General Estimates System and Crash Report Sampling System, National Highway Traffic Safety Administration, U.S. Department of Transportation.
1 According to the National Highway Traffic Safety Administration, overall economic costs of all motor vehicle crashes in the US in 2019 totaled $339.8 billion in 2019. Note that the lifetime direct economic cost to society for each fatality is $1.6 million. Over 90 percent of this amount is attributable to lost workplace and household productivity and legal costs. Meanwhile, overall comprehensive crash costs nationally, representing both economic impacts and valuation for lost quality-of-life, was $1.37 trillion in 2019. Seventy-five percent of this value represents lost quality of life, while 25 percent are economic impacts. Based on Departmental Guidance on Valuation of a Statistical Life in Economic Analysis. U.S. Department of Transportation, Washington, DC. March 23, 2021, the lifetime comprehensive cost to society for each fatality in 2022 was $12.5 million.
2 Kartikeya, J., and L. Albert. Congestion Pie Chart for Different Sources of Congestion. Technical Memorandum submitted to the Support for Urban Mobility Analysis Federal Highway Administration Pooled Fund Study. Texas A&M Transportation Institute, College Station, Texas, August 2021.
3 Computed using data from the INRIX 2022 Global Traffic Scorecard, assuming work zones contribute 10 percent to national congestion estimates.
Data Sources
Crash data shown here come from the 50 states, the District of Columbia, and Puerto Rico. The numbers for fatal crashes come from the Fatality Analysis Reporting System, National Highway Traffic Safety Administration, U.S. Department of Transportation. The numbers for estimated injuries, injury crashes, and total crashes come from the General Estimates System (GES) and the Crash Report Sampling System (CRSS), National Highway Traffic Safety Administration, U.S. Department of Transportation. GES/CRSS provide only national estimates of work zone crashes and may underrepresent the actual numbers of work zone injuries and crashes that occur.