• Skip to primary navigation
  • Skip to main content
Logo

Work Zone Safety Information Clearinghouse

Library of Resources to Improve Roadway Work Zone Safety for All Roadway Users

  • About
  • Newsletter
  • Contact
  • X
  • Facebook
  • LinkedIn
  • Work Zone Data
    • At a Glance
    • National & State Traffic Data
    • Work Zone Traffic Crash Trends and Statistics
    • Worker Fatalities and Injuries at Road Construction Sites
  • Topics of Interest
    • Commercial Motor Vehicle Safety
    • Smart Work Zones
    • Work Zone Safety and MobilityTransportation Management Plans
    • Accommodating Pedestrians
    • Worker Safety and Welfare
    • Project Coordination in Work Zones
  • Training
    • Online Courses
    • FHWA Safety Grant Products
    • Toolboxes
    • Flagger
    • Certification and
      Accreditation
  • Work Zone Devices
  • Laws, Standards & Policies
  • Public Awareness
  • About
  • Events
  • Contact
  • Search

Work Zone Data

Work Zone Data

  • At a Glance
  • National & State Traffic Data
  • Work Zone Traffic Crash Trends and Statistics
  • Worker Fatalities and Injuries at Road Construction Sites

Work Zone Traffic Crash Trends and Statistics

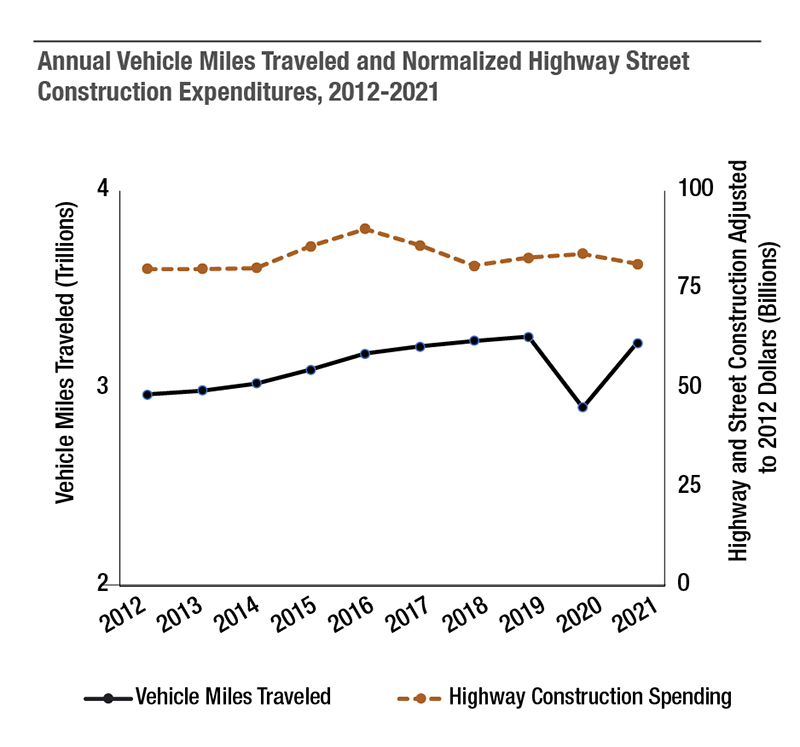
Data on fatal traffic crashes in work zones come from the Fatality Analysis Reporting Systems from the National Highway Traffic Safety Administration.1  These data represent crashes coded as occurring in a work zone from all 50 states, the District of Columbia, and Puerto Rico. These data are extracted from law enforcement crash report forms, and as such are only as accurate as the data included in those reports. Estimates of injuries and total crashes occurring in work zones come from the NHTSA Crash Report Sampling System (CRSS) and the General Estimates System (GES).2 Data on annual vehicular travel in the U.S. comes from the Bureau of Transportation Statistics, U.S. Department of Transportation.3 Data regarding Highway, Street and Bridge Construction Employment in the U.S. comes from the Bureau of Labor Statistics, U.S. Department of Labor.4 These data represent national estimates of employment from all 50 states and the District of Columbia. As of July 2024, industry employment data is being used instead of inflation-adjusted Highway and Street Construction Expenditures. This is because the employment data provides a more natural benchmark for work zone exposure. Trends in the normalized spending data can also be highly sensitive to the choice of cost or price index.

Click on a graphic of interest below to get data details.

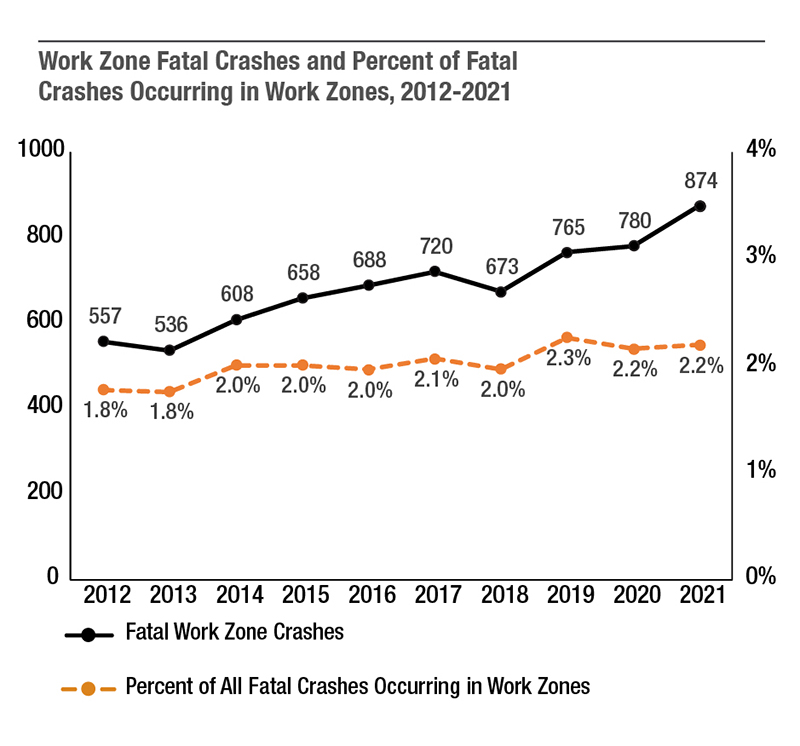
Over the past 10 years, fatal crashes in work zones have increased from 536 in 2013 to 821 in 2022, peaking in 2021 at 880. The percent of all fatal crashes that occur in work zones has also increased slightly, from 1.8 percent in 2013 to 2.1 percent in 2022. (Source: NHTSA FARS)
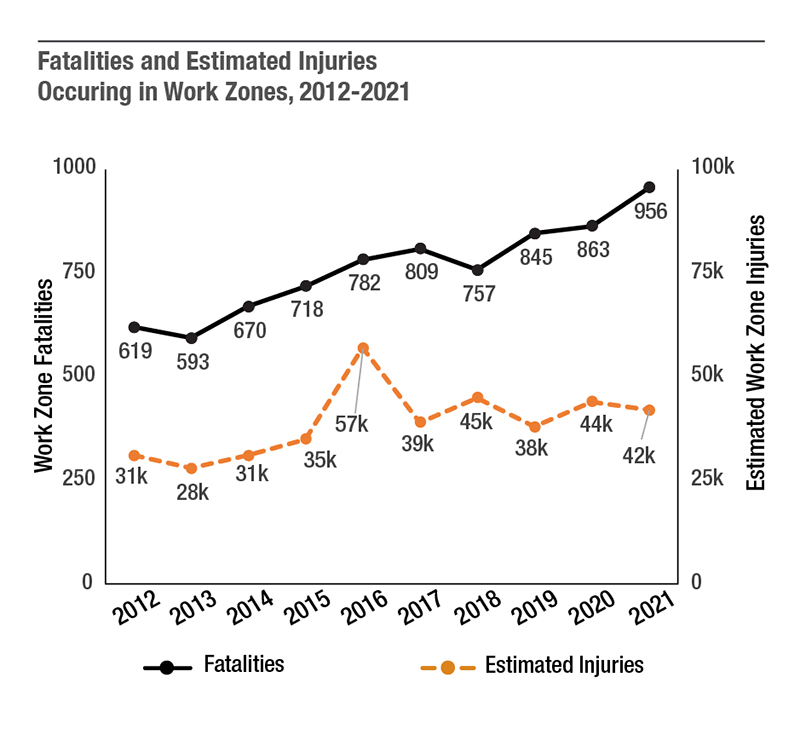
Over the past 10 years, work zone fatalities have increased from 593 in 2013 to 891 in 2022. This equates to more than two persons per day being killed in work zones in 2022. Approximately four out of every five work zone fatalities involve a driver or passenger of a vehicle. Meanwhile, estimated injuries in work zones have also increased, from 28,000 in 2013 to 37,000 in 2022. In 2022, this equates to approximately 101 injuries per day in work zones. (Source: NHTSA FARS, GES, and CRSS)
In general, the increase in work zone fatalities and injuries over time has correlated with increased vehicular travel nationally, except in 2022 when work zone fatalities and injuries decreased and in 2020 when travel dropped significantly due to the COVID pandemic (Source: Bureau of Transportation Statistics).  In addition, the 2022 decrease in work zone fatalities and injuries occurred even as highway, street, and bridge construction employment continues to rise (Source: Bureau of Labor Statistics).
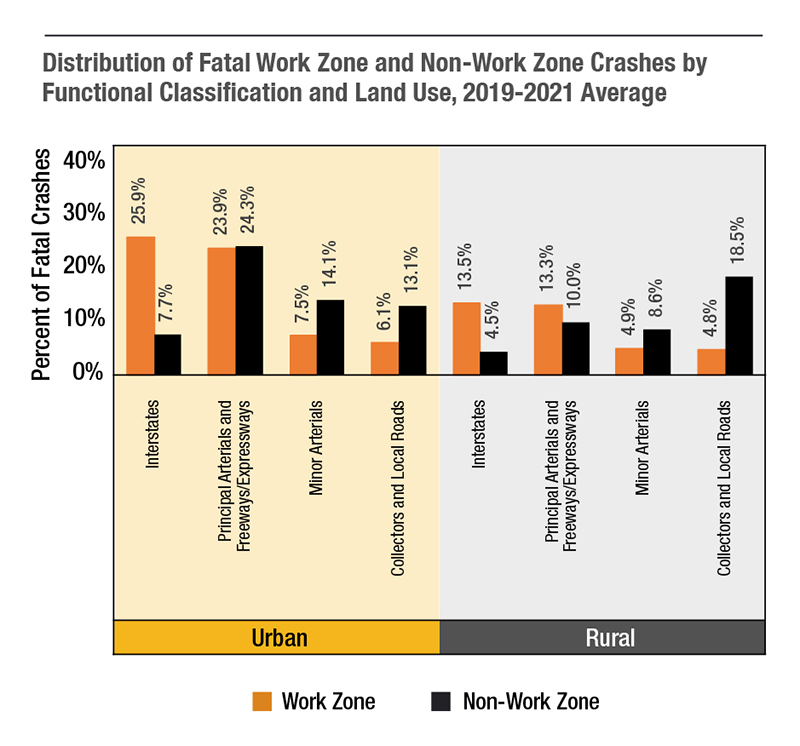
Compared to fatal non-work zone crashes, fatal work zone crashes are overrepresented on urban interstates, rural interstates, and rural principal arterials and freeways/expressways. (Source: NHTSA FARS)
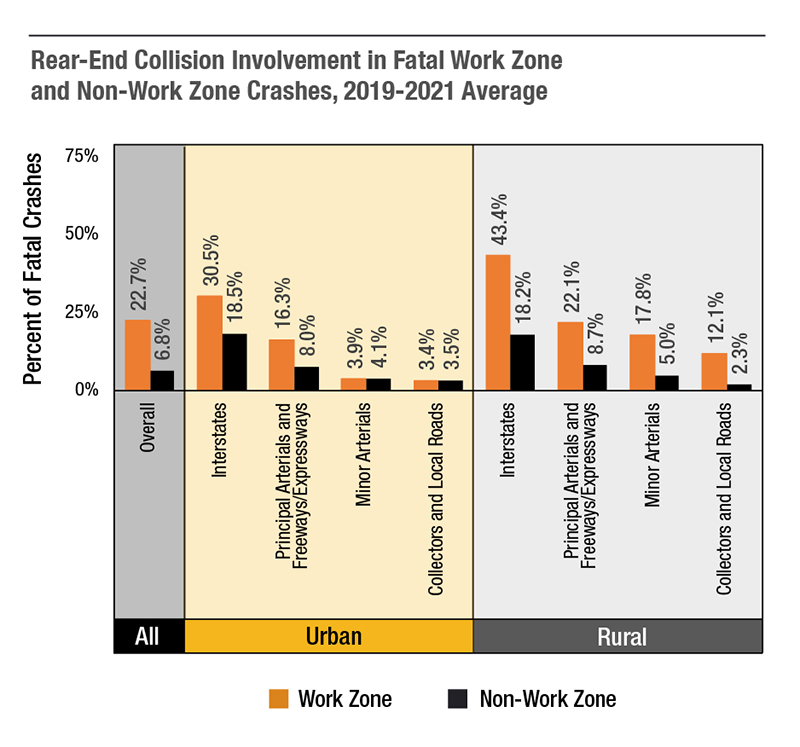
Rear-end collision involvement is consistently higher for fatal work zone crashes than for fatal non-work zone crashes. The overrepresentation is most apparent on rural roadways. (Source: NHTSA FARS)

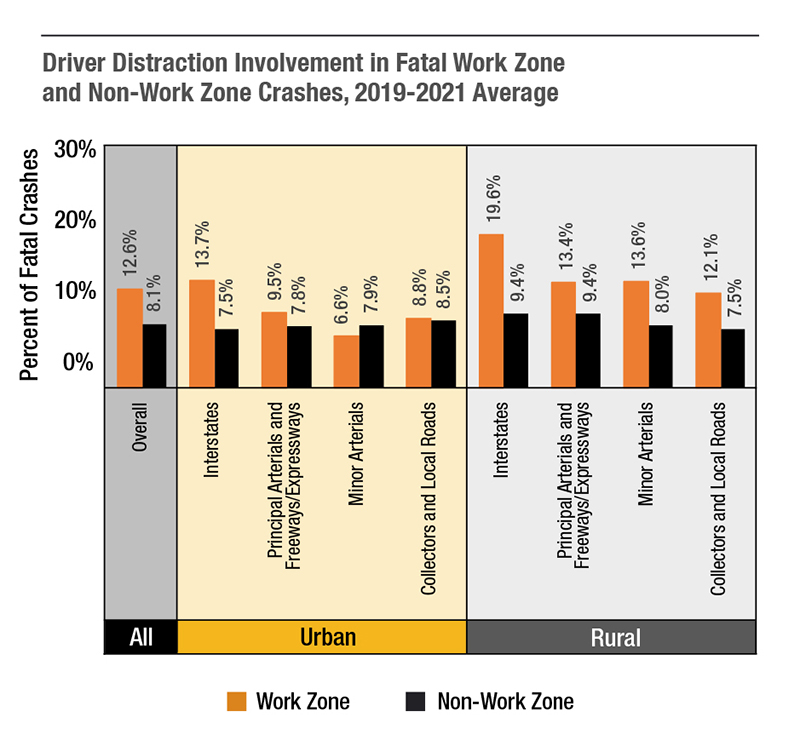
Driver distraction contributes to fatal work zone crashes more often than to fatal non-work zone crashes. The overrepresentation is particularly evident on urban interstates, rural interstates, and rural collectors and local roads. (Source: NHTSA FARS)
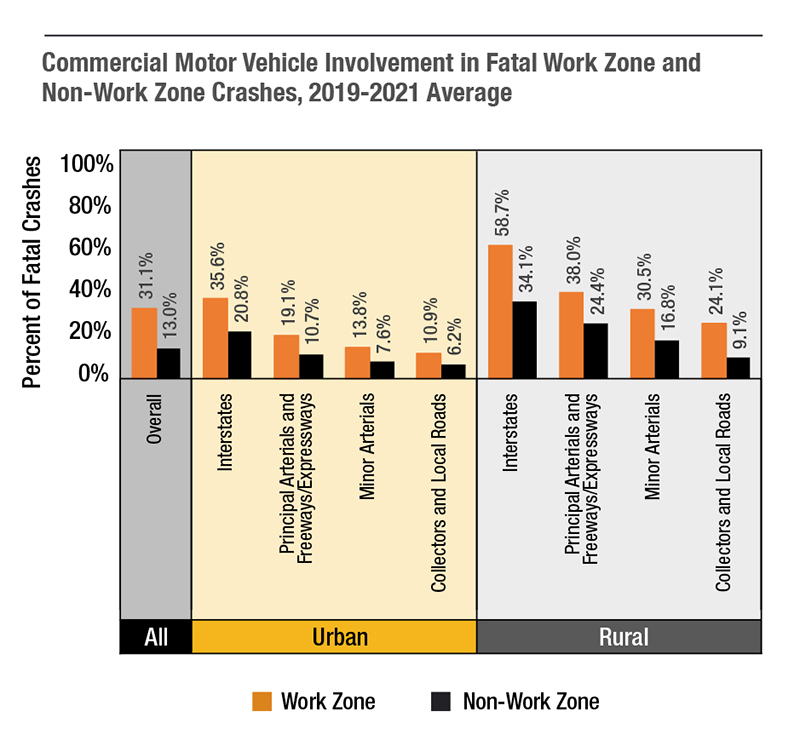
Commercial motor vehicles (large trucks with a gross vehicle weight rating of more than 10,000 lbs and buses) are highly overrepresented in fatal work zone crashes as compared to fatal non-work zone crashes. In fact, commercial motor vehicles are involved in over 50 percent of fatal work zone crashes that occur on rural interstates. (Source: NHTSA FARS)

1 Fatality Analysis Reporting System. National Highway Traffic Safety Administration, U.S. Department of Transportation, Washington, D.C.  Accessible at https://www.nhtsa.gov/research-data/fatality-analysis-reporting-system-fars.

2 Crash Report Sampling System. National Highway Traffic Safety Administration, U.S. Department of Transportation, Washington, D.C.  Accessible at https://www.nhtsa.gov/crash-data-systems/crash-report-sampling-system.

3 U.S. Vehicle Miles. Bureau of Transportation Statistics, U.S. Department of Transportation, Washington, D.C.  Accessible at https://www.bts.gov/content/us-vehicle-miles.

4 Employment, Hours, and Earnings from the Current Employment Statistics survey (National). U.S. Department of Labor, Washington, D.C., Accessible at https://www.bls.gov/ces/data/.

Copyright © 2025 American Road & Transportation Builders Association (ARTBA). The National Work Zone Safety Information Clearinghouse is a project of the ARTBA Transportation Development Foundation. It is operated in cooperation with the U.S. Federal Highway Administration and Texas A&M Transportation Institute. | Copyright Statement · Privacy Policy · Disclaimer
American Road and Transportation Builders Association Transportation Development Foundation, American Road and Transportation Builders Association U.S. Department of Transportation Federal Highway Administration Texas A&M Transportation Institute